Splunk Dashboard - Firewall Analysis
Project Overview
This project involves designing a Splunk dashboard to provide a quick and actionable overview of firewall traffic and activities. Leveraging Splunk’s Search Processing Language (SPL), the dashboard analyzes firewall logs to help Security Operations Center (SOC) analysts monitor firewall rules, detect anomalies, and identify potential threats efficiently. This project demonstrates my proficiency with SIEM tools like Splunk, my ability to extract meaningful insights from security data, and my focus on delivering user-friendly visualizations—key skills for a SOC analyst role.
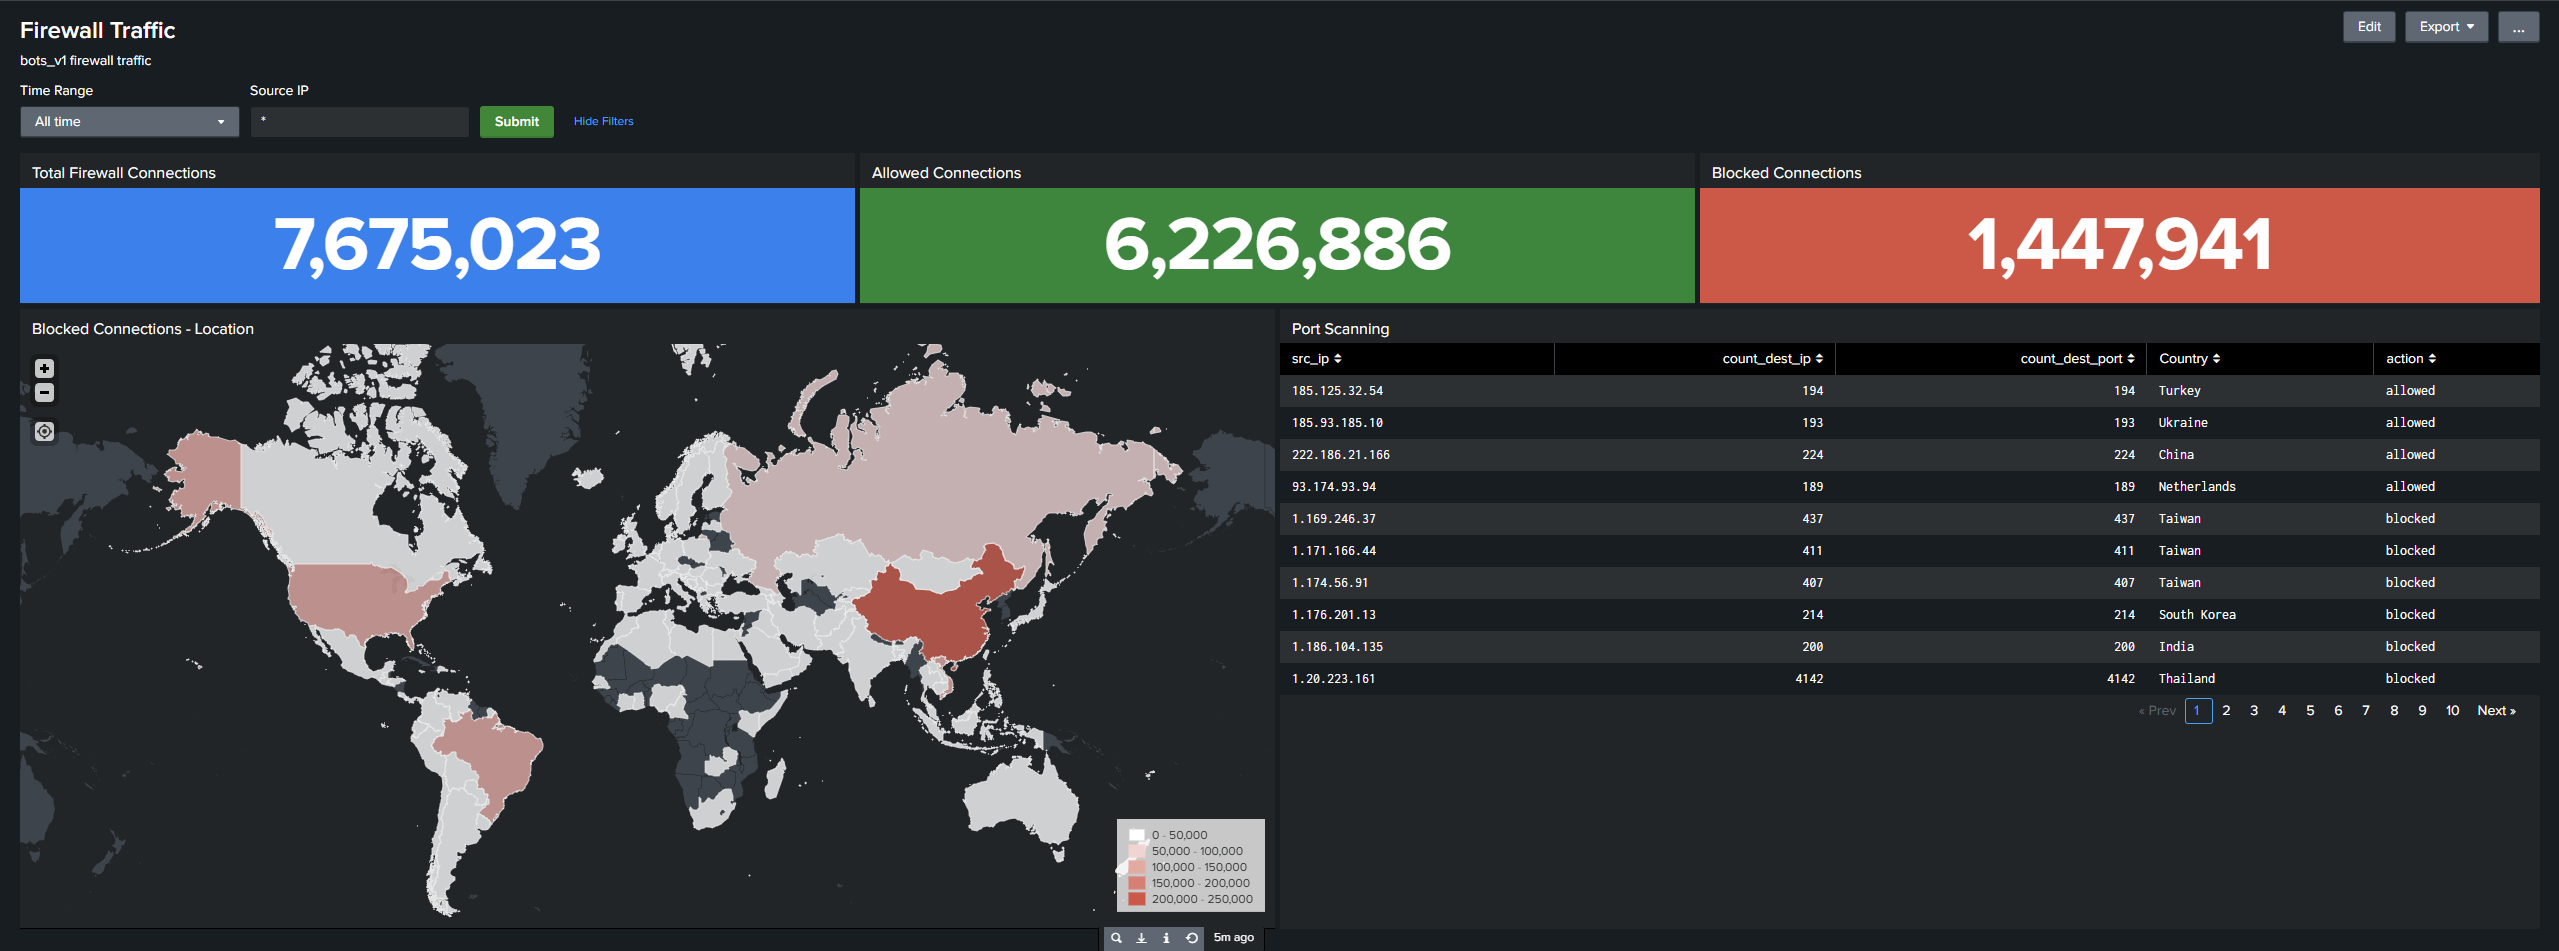 Firewall Traffic Analysis Dashboard
Dataset
The dashboard is built using the Splunk BOTS (Boss Of The SOC) v1 dataset, a popular dataset for security analysis in SOC challenges. It contains a variety of security events, including firewall logs from FortiGate devices (sourcetype=fortigate_traffic), which were the focus of this project for analyzing firewall traffic.
Project Objective
The primary objective of this project is to:
- Use SPL to filter and aggregate firewall traffic data from the BOTS v1 dataset.
- Extract key metrics such as total connections, allowed/blocked connections, geographic distribution of blocked traffic, and port scanning activities.
- Present these metrics in a visually intuitive dashboard that allows SOC analysts to quickly assess the current posture of firewall rules and activities, supporting rapid threat detection and response.
Dashboard Features
The Splunk dashboard provides the following insights at a glance:
- Total Firewall Connections: Displays the total number of firewall connections (3,703,125 in the sample).
- Allowed Connections: Shows the number of connections permitted by the firewall (3,383,831), indicating normal traffic flow.
- Blocked Connections: Highlights the number of blocked connections (1,447,941), which may indicate potential threats or misconfigurations.
- Geographic Distribution of Blocked Connections: A world map visualizing the locations of blocked connections, with significant activity from regions like China, the United States, and Brazil.
- Port Scanning Activity: A detailed table listing source IPs, destination IP/port counts, countries, and actions (allowed/blocked) for potential port scanning activities, helping analysts identify reconnaissance attempts.
The dashboard uses color-coded panels (blue for total connections, green for allowed, and red for blocked) to ensure quick interpretation of critical metrics, with a focus on usability for SOC analysts under time pressure.
Technical Implementation
The dashboard was created using Splunk’s SPL to query and aggregate the BOTS v1 dataset. Below are the SPL queries used for each panel, along with explanations of their functionality.
1. Total Firewall Connections
1
2
3
index=botsv1 sourcetype=fortigate_traffic src_ip=$ip_token$
| stats count by action
| stats sum(count)
This query counts all firewall events, grouped by action (allowed or blocked), and sums them to display the total number of connections (3,703,125). The src_ip=$ip_token$ allows dynamic IP filtering for interactivity.
2. Allowed Connections
1
2
3
4
index=botsv1 sourcetype=fortigate_traffic src_ip=$ip_token$
| stats count by action
| search action=allowed
| table count
Filters for allowed connections (3,383,831) and displays the count in a single-value panel, colored green to indicate normal traffic.
3. Blocked Connections
1
2
3
4
index=botsv1 sourcetype=fortigate_traffic src_ip=$ip_token$
| stats count by action
| search action=blocked
| table count
Filters for blocked connections (1,447,941) and displays the count in a red-colored panel to highlight potential threats.
4. Geographic Distribution of Blocked Connections
1
2
3
4
5
index=botsv1 sourcetype=fortigate_traffic action=blocked src_ip=$ip_token$
| table src_ip
| iplocation src_ip
| stats count by Country
| geom geo_countries featureIdField="Country"
Maps blocked connections to their source countries (e.g., China, United States, Brazil) using Splunk’s geom command, displayed as a choropleth map.
5. Port Scanning Activity
1
2
3
4
5
index=botsv1 sourcetype="fortigate_traffic" src_ip=$ip_token$
| stats count(dest_ip) as count_dest_ip count(dest_port) as count_dest_port by action src_ip
| iplocation src_ip
| search count_dest_ip>100 AND count_dest_port>100 AND Country!="United States"
| table src_ip count_dest_ip count_dest_port Country action
Identifies potential port scanning by filtering source IPs (excluding US IPs, as the dataset is from a fictional US-based company) with high destination IP/port counts, displayed as a table for investigation.
Value for SOC Analysts
This dashboard provides significant value to SOC analysts by:
- Offering a quick snapshot of firewall activity, reducing the time needed to identify potential issues.
- Highlighting blocked connections and their geographic origins, which can indicate malicious activity or the need for rule adjustments.
- Identifying port scanning activity, a common precursor to cyberattacks, enabling analysts to investigate specific IPs or ports for faster incident response.
Challenges and Learnings
- Challenge: Optimizing SPL queries to handle large volumes of firewall logs efficiently.
- Learning: Gained expertise in using SPL commands like
stats,iplocation, andgeom, improving my ability to process and visualize security data. - Challenge: Balancing detailed insights (e.g., port scanning table) with high-level summaries (e.g., total connections) in a single dashboard.
- Learning: Developed skills in Splunk dashboard design, focusing on usability and color coding to ensure clarity for analysts under time pressure.
Future Improvements
- Trend Analysis: Add a time-series chart to track blocked connections over time (
index=botsv1 sourcetype="fortigate_traffic" action=blocked | timechart count). - Alert Integration: Configure Splunk alerts to notify analysts of critical thresholds, such as a sudden increase in blocked connections from a single IP.
- Interactive Drill-Downs: Enable drill-downs on the map and table for deeper investigation of raw events.
Conclusion
This Splunk dashboard demonstrates my ability to use SPL for firewall traffic analysis and create actionable visualizations tailored for a SOC environment. By presenting key firewall metrics in a clear and concise manner, the dashboard equips SOC analysts with the insights needed to monitor and respond to potential security threats effectively. This project highlights my technical skills in SIEM tools, data analysis, and security operations, making me a strong candidate for a SOC analyst role.